Documentation examples
Last updated on 2026-04-28 | Edit this page
Overview
Questions
- What does well-documented code look like?
Objectives
- Be introduced to good software documentation practices
Code examples
In this episode we’ll review some examples of research software and evaluate how readable and reusable it is. The examples are deliberately small and illustrative: the same documentation principles apply to any research code, whether you’re working with text and corpora, qualitative coding, survey data, clinical records, or quantitative measurements.
Example of no documentation
Here is some code intended to process a piece of text. What does this code do? It’s not clear what the code is for or why it was written.
Challenge
Read and evaluate this code.
- What is the purpose of this function?
- What do the variables mean?
- Would you rely on this code in your research? Why, or why not?
The function name doesn’t explain what the code does, and there are
no comments or notes to clarify the author’s intent. The variable names
don’t help either: what does x represent? Where would we
look to find out more about weird_num? It’s effectively a
“magic” number, stated arbitrarily and left unexplained. The logic of
the expression is equally cryptic.
In fact a closer read shows the code can’t even run as written:
sep and skipped are referenced but never
defined. Without documentation, mistakes like that are easy to overlook
until something breaks.
Well-documented example
Now let’s look at an example of best practices in documenting research software. (These snippets come from the end product of this course, so don’t worry if they don’t make sense yet.)
Read and evaluate this code.
- Can you tell what the purpose of the function is?
- What is the meaning of the variables?
- Which code would you prefer to use?
This time, the function name is a verb that describes what the code
does. A clear description spells out the purpose for the reader, and
comment lines (starting with #) explain how the calculation
works. Each variable has a descriptive, human-readable name, and
built-in language features handle the splitting of the text, so a reader
can look up split() or strsplit() elsewhere
rather than puzzling over a bespoke implementation.
The result is code that is much easier to interpret, maintain, and modify in the future.
Some of the syntax in this example may be unfamiliar—that’s fine. We’ll cover the basics as the course progresses.
Real-world examples
Let’s review real-world examples of the documentation for software packages that are used in research. The two examples below come from the quantitative-sciences mainstream, but the same documentation patterns turn up in tools used right across the disciplines—for example text-analysis libraries such as spaCy or quanteda, and many qualitative-data and digital-humanities packages.
NumPy user guide
NumPy is a mathematical package for Python, widely used for quantitative computing and linear algebra. The NumPy User Guide is a thorough website, organised into sections that cover different aspects of the package.
It includes a beginner’s guide, tutorials for common use cases, and in-depth write-ups of specific technical details. Some content assumes no prior knowledge; other parts serve as a reference for readers with a background in mathematics or programming.
If we want to read more about how to use a certain feature, there are
documentation pages such as numpy.array
that describe purpose and the parameters of each function. If we’re in a
Python interpreter shell, we can use the help()
in-built function to view the documentation:
PYTHON
Help on built-in function array in module numpy:
array(...)
array(object, dtype=None, *, copy=True, order='K', subok=False, ndmin=0,
like=None)
Create an array.
Parameters
----------
object : array_like
An array, any object exposing the array interface, an object whose
``__array__`` method returns an array, or any (nested) sequence.
If object is a scalar, a 0-dimensional array containing object is
returned.
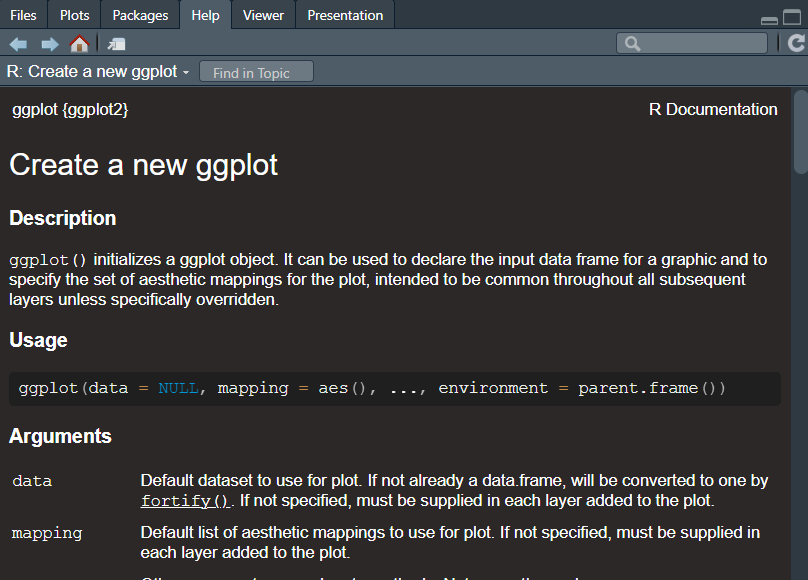
...ggplot2 documentation site
ggplot2 is a package for the R statistical language that produces data visualisations and graphics. The ggplot2 documentation has a simple, accessible layout that walks a new user through installing the package and getting up and running. It also provides a “cheat sheet”: a reference guide that lists commonly used commands in an attractive two-page layout. The documentation is moderate in scope and links out to further resources, such as online courses hosted elsewhere.
In R, we can view the documentation for each function by using the
? syntax. For example, calling
?ggplot2::ggplot will show the help text for that function
or load the reference information in a web browser. Also, if we ever
needed to read it, the source code is neatly organised into R code files
in the repository. For example, the function ggplot()
includes an extensive description of the purpose and operation of that
code, including a list of the parameters and examples of how to use
it.
R
install.packages("ggplot2")
library(ggplot2)
?ggplot2::ggplot